Abortion Rate Project |
Resources |
|
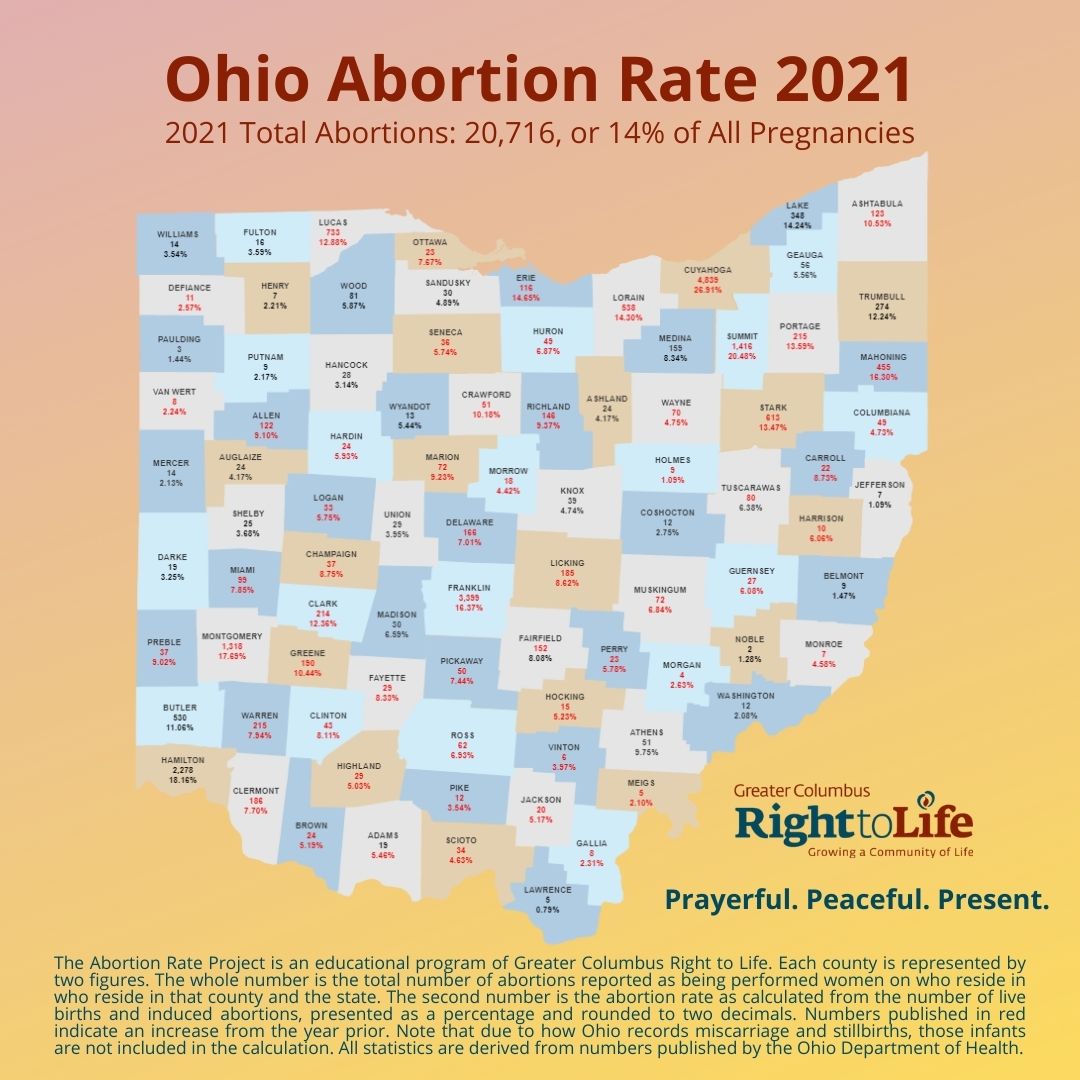
As part of our work to track trends and deploy resources to the communities where they are most needed, we not only monitor the number of abortions happening in our community, but we also look at the number of women who are having abortions by county. Several years ago, we realized that this only tells part of the story, and we began looking at the number of abortions happening as a percentage of the total number of otherwise viable pregnancies. What we've found helps us to better understand how abortion is impacting communities regardless of the size of that community. After all, counties with larger populations are more likely to have larger numbers of abortions. But tracking shifts in abortion trends and the abortion rate from community to community can help us to understand what areas need a little more help and which areas we should look to for ideas to improve.
What we've found has been astonishing. Abortion rates in Ohio vary widely across the state, from less than 1% in Lawrence County to nearly 27% in Cuyahoga. |
NoteThese numbers only provide a snapshot of what is going on based on abortions reported to the Ohio Department of Health under Ohio law. This means the numbers do not include women who may reside in Ohio but had an abortion in another state or abortions obtained illegally (ex: by mail) or (illegally) not reported to the ODH. It also does not include anything that is not considered induced abortion under Ohio law, such as embryos destroyed during IVF or prohibited from implantation due to various contraceptives.
|
